Administrator Guide
Complete guide for GAHP administrators. Learn how to create surveys, analyze responses, manage users, and leverage GAHP's powerful analytics to make data-driven decisions.
Open https://gahp.omatic.com.ar/ in your browser. Enter your admin credentials and click LOG IN.

Figure 1: The GAHP login screen
After a successful login, you will be redirected to the Admin Dashboard.
The Admin Dashboard gives you a quick overview of your system. Here you can see:
- Active Surveys — how many surveys are currently published and available
- Total Responses — how many survey responses have been submitted
- Last Activity — when the most recent response was received
- Users — the total number of registered users
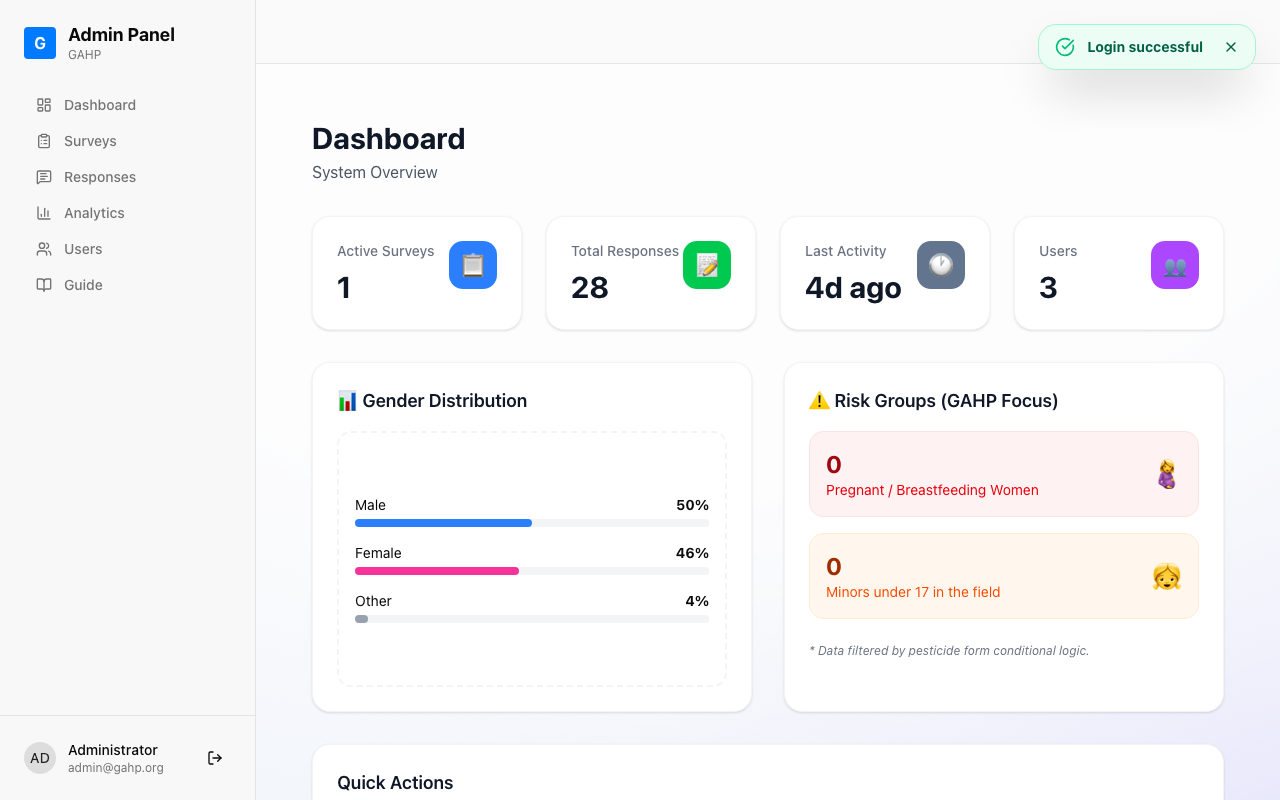
Figure 2: The Admin Dashboard shows system statistics at a glance, including mini analytics charts
The dashboard also shows mini charts for Gender Distribution and Risk Groups — giving you immediate insight into your data without needing to navigate to the full Analytics page.
From the sidebar, click Surveys, then click NEW SURVEY in the top right. Fill in the survey Title and an optional Description, then click Create and Edit Fields.
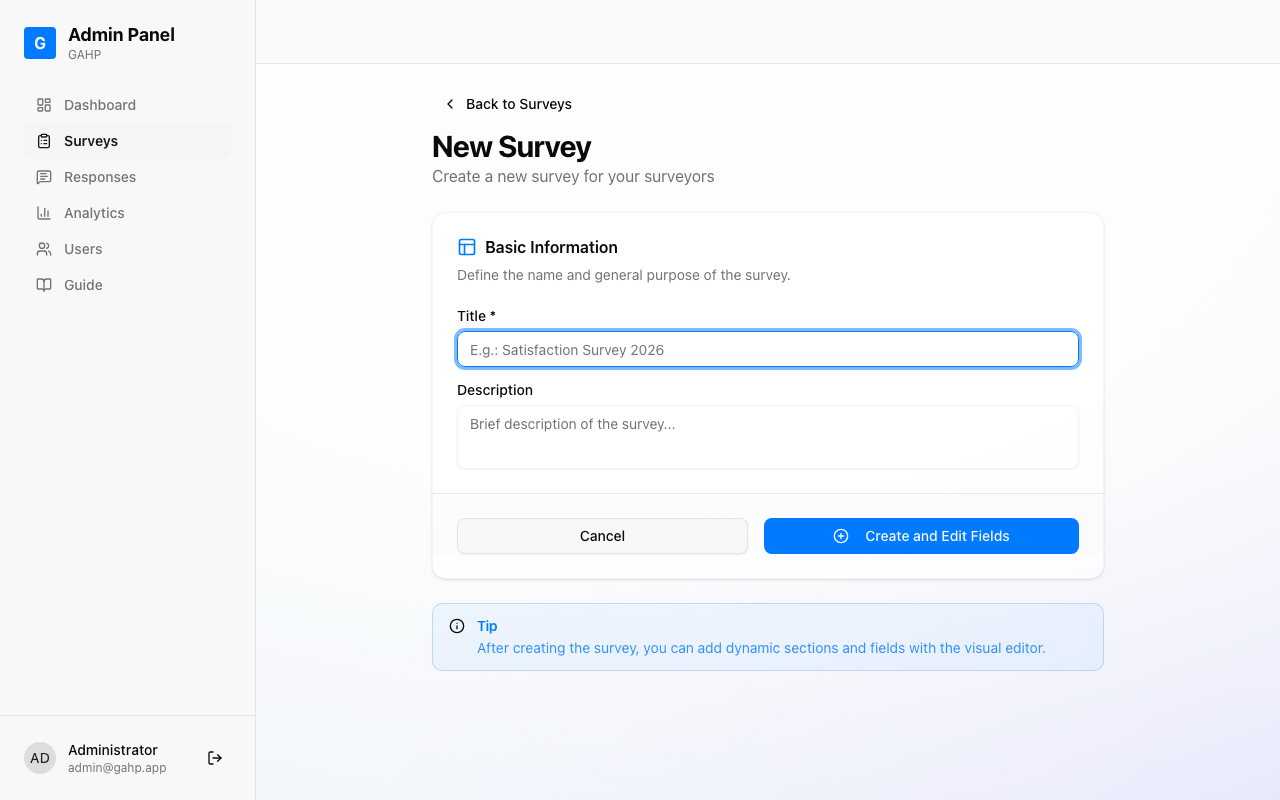
Figure 3: Fill in the title and description, then create the survey
You will be taken directly to the Survey Editor where you can add fields to your survey.
The Survey Editor has three main areas:
- Field Palette (left side) — contains the field types you can add
- Section Editor (center) — shows the current section and its fields
- Preview (right side) — live preview of your survey

Figure 4: The Survey Editor with its main areas labeled
Available Field Types
GAHP supports 11 field types, each designed for specific data collection needs:
| Field Type | Icon | Use For | Configuration Options |
|---|---|---|---|
| TEXT | Type icon | Open-ended text answers, names, addresses | Label, Placeholder, Required |
| NUMBER | Hash icon | Numeric values (ages, quantities, measurements) | Label, Placeholder, Required, Min, Max |
| OPTION | ChevronDown icon | Single choice from a dropdown list | Label, Placeholder, Required, Options list |
| MULTI-SELECT | CheckSquare icon | Multiple choices from a list (checkboxes) | Label, Placeholder, Required, Options list |
| YES/NO | ToggleRight icon | Binary yes/no questions | Label, Required |
| SCALE | Number buttons | Rating scales (e.g., 1-5 satisfaction) | Label, Required, Min, Max |
| DATE | Calendar icon | Date selection | Label, Required |
| CHECKBOX | Square icon | Single checkbox (agree/disagree) | Label, Required |
| PHOTO | Camera icon | Capture photos using the device camera | Label, Required |
| LOCATION | MapPin icon | GPS coordinates capture | Label, Required |
| TEXTAREA | Type icon | Long text responses | Label, Placeholder, Required |
To add a field:
- Click the field type button in the Field Palette
- The field is automatically added to the current section
- Click the expand arrow (▼) on the field card to edit its label, placeholder, and options
Configuring a field
When you expand a field, you can set:
- Label — the question text shown to the surveyor
- Placeholder — helper text shown inside the input
- Required — toggle on to force the surveyor to answer (marked with •)
- Options — for OPTION and MULTI-SELECT fields, type one option per line
- Min/Max — for NUMBER and SCALE fields, set valid ranges
Undo and Redo
Made a mistake? Use the Undo and Redo buttons in the top bar to reverse or reapply changes. These buttons will enable once you make your first change.
When you are satisfied with your survey, click the green Publish button in the top right of the editor.
After publishing, you will be redirected to the Surveys List where you can see your newly published survey.
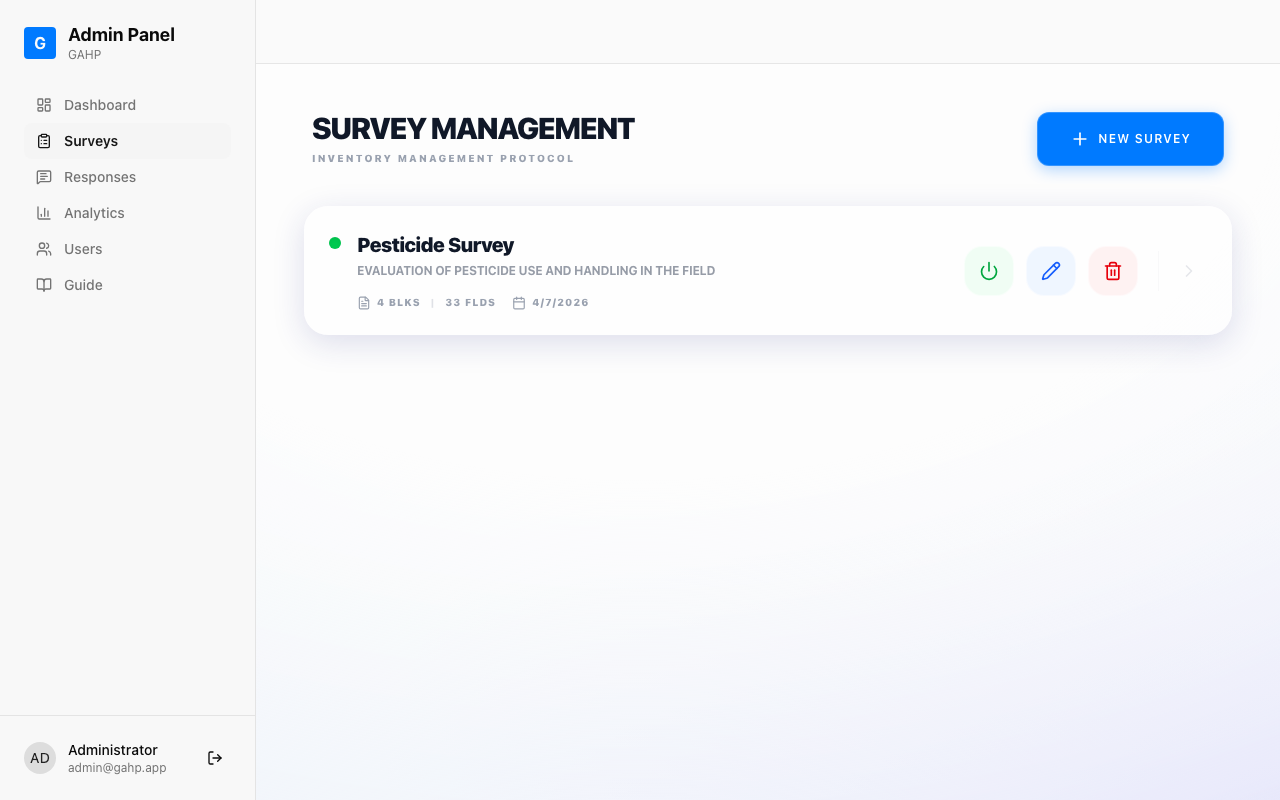
Figure 5: The Surveys List shows all surveys. Use "Deactivate" to hide a survey from surveyors without deleting it.
The Analytics page is the heart of GAHP's reporting capabilities. It provides visual charts and insights from all submitted survey responses.
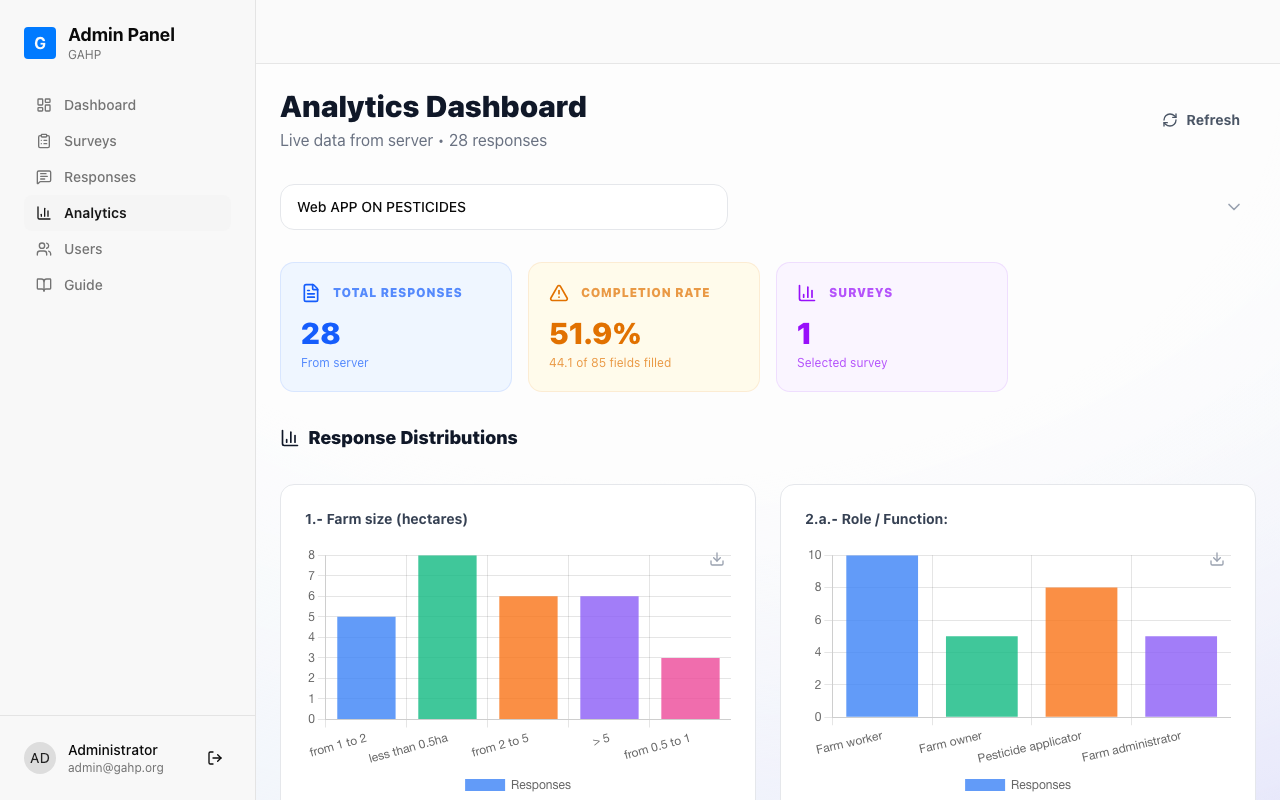
Figure 6: The Analytics Dashboard provides comprehensive visualizations of your survey data
Available Charts
GAHP Analytics includes these powerful visualizations:
- Gender Distribution — Pie chart showing response breakdown by gender
- Risk Groups Analysis — Identifies groups that may need additional attention or intervention
- Response Trends — See how responses vary over time
- Field-specific Analytics — Each survey question with options-based answers gets its own chart
Understanding Risk Groups (GAHP Focus)
GAHP is designed with agricultural health and safety in mind. The Risk Groups feature identifies survey respondents who may face higher risks based on their responses. For example:
- Respondents who apply pesticides without protective equipment
- Workers who started handling pesticides at a young age
- Those who lack access to clean water for washing
- Respondents showing signs of past pesticide poisoning
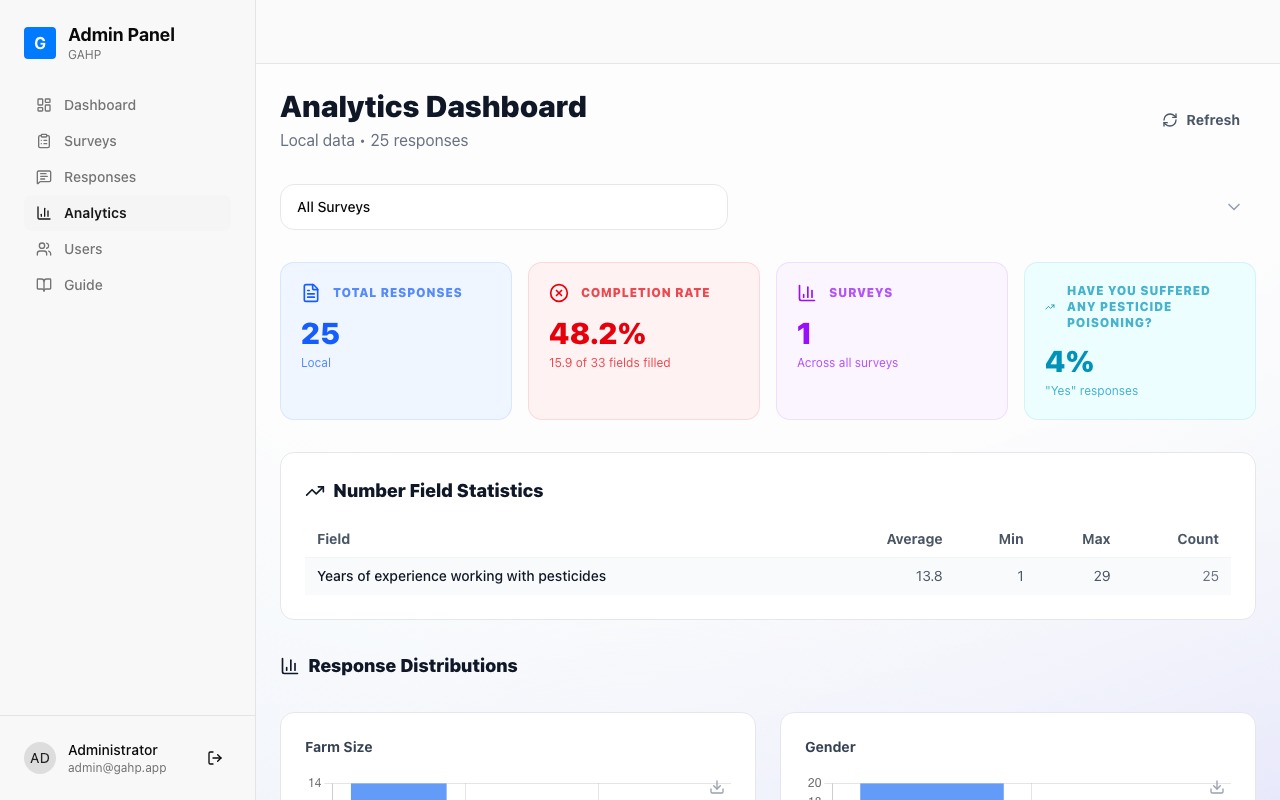
Figure 7: Gender Distribution chart helps understand demographic breakdown
GAHP allows you to export your survey data in three formats, accessible from the Responses page:

Figure 8: Use CSV, Excel, or PDF buttons to export your data
Export Formats
| Format | Best For | Contains |
|---|---|---|
| CSV | Importing into other tools, spreadsheets, or databases | All responses, all fields, raw data |
| Excel | Data analysis, filtering, creating custom reports | Formatted tables, multiple sheets, preserved formatting |
| Sharing with stakeholders, printing, formal reports | Formatted report with charts, summary statistics |
Filtering Data Before Export
Use the dropdown filters at the top of the Responses page to:
- Filter by Survey — Select a specific survey if you have multiple
- Filter by Status — Choose "All", "Synced," or "Pending"
Click Responses in the sidebar to see all submitted survey responses. You can view individual responses, see their sync status (synced or pending), and track when each was submitted.
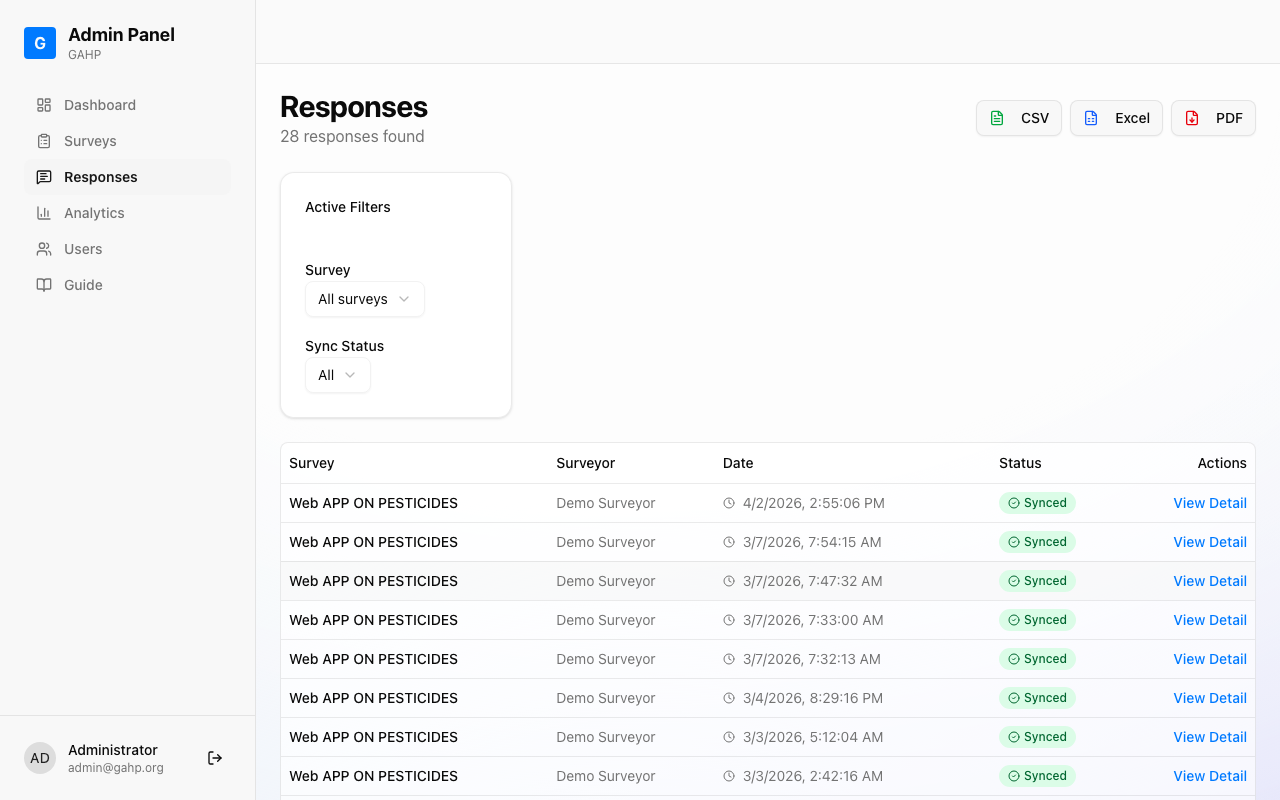
Figure 9: The Responses page shows all submitted survey data with status indicators
Each row shows:
- Survey — which survey the response belongs to
- Surveyor — who submitted it
- Date — when it was submitted
- Status — Synced (uploaded) or Pending (waiting to upload)
Click Users in the sidebar to manage user accounts. Administrators can create surveyor accounts and assign credentials.
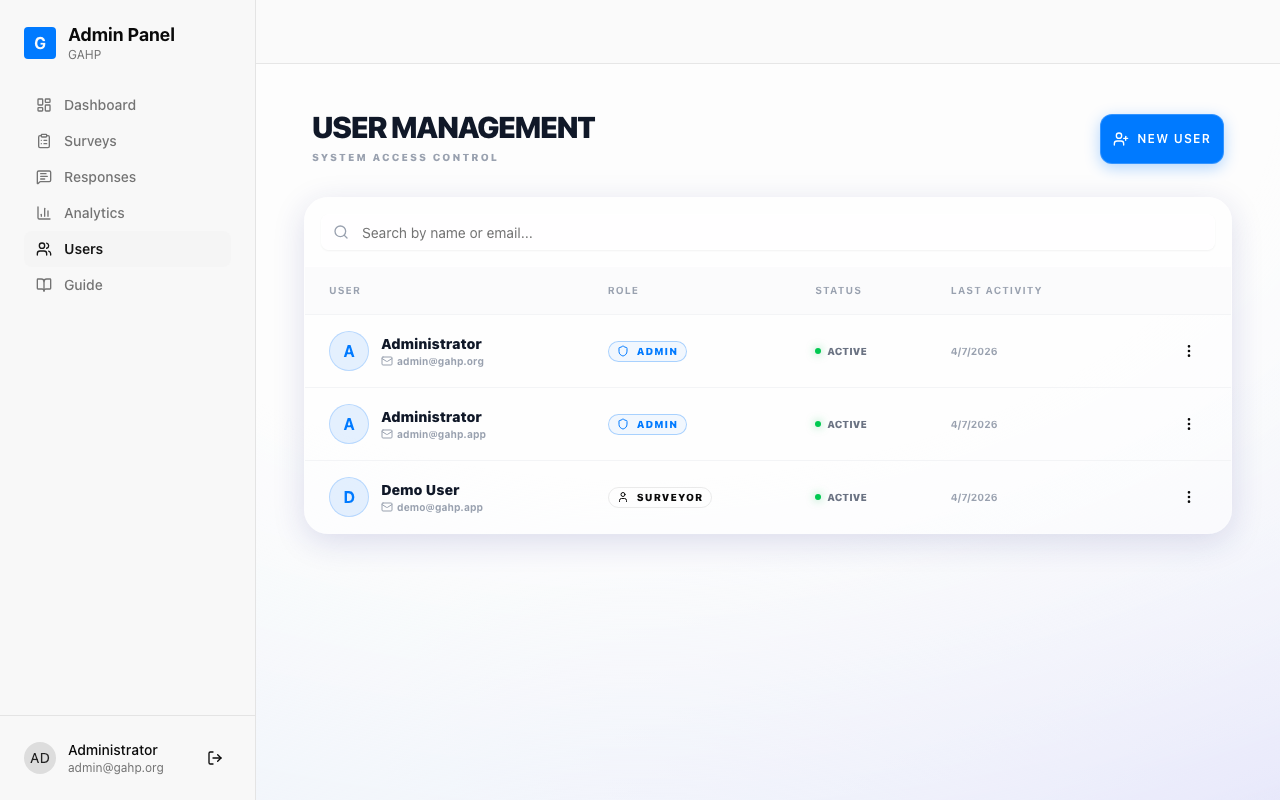
Figure 10: The Users page lets you create and manage user accounts
To add a new user:
- Click + Add User
- Fill in the user's Name, Email, and Role
- Choose a Temporary Password for the user
- Click Save
Roles and Permissions
| Role | Can Do | Cannot Do |
|---|---|---|
| Administrator | Create/edit/delete surveys, view all responses, access analytics, manage users | — (full access) |
| Surveyor | Complete assigned surveys, view own responses | Create surveys, view other users' data, manage users |
To modify a survey that's already published:
- Go to Surveys in the sidebar
- Find your survey and click the pencil icon (Edit)
- Make your changes in the Survey Editor
- Changes are saved automatically as you edit
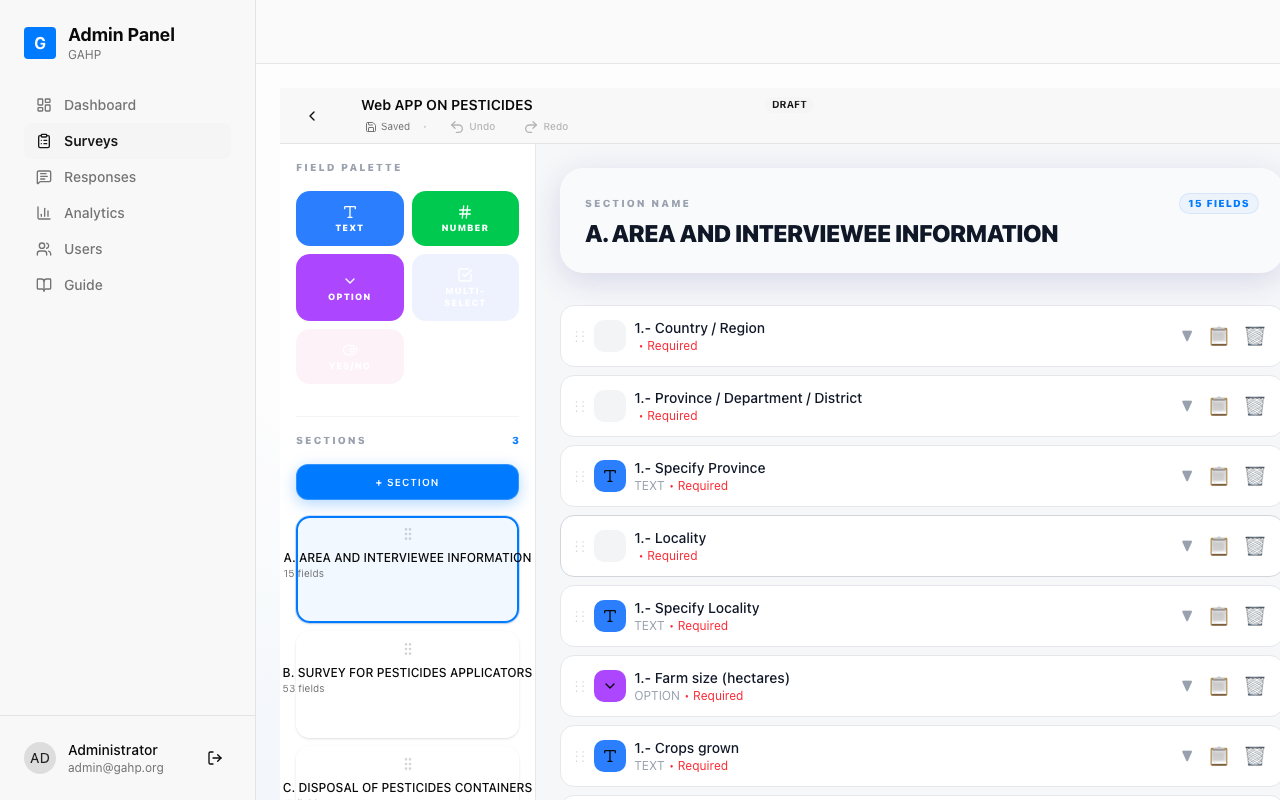
Figure 11: Click the pencil icon to edit a survey
What You Can Edit
- Add or remove fields
- Change field labels or options
- Add or remove sections
- Reorder fields and sections
- Mark fields as required or optional
Surveys are organized into Sections, which group related questions together. Surveyors see one section at a time as they progress through the survey.
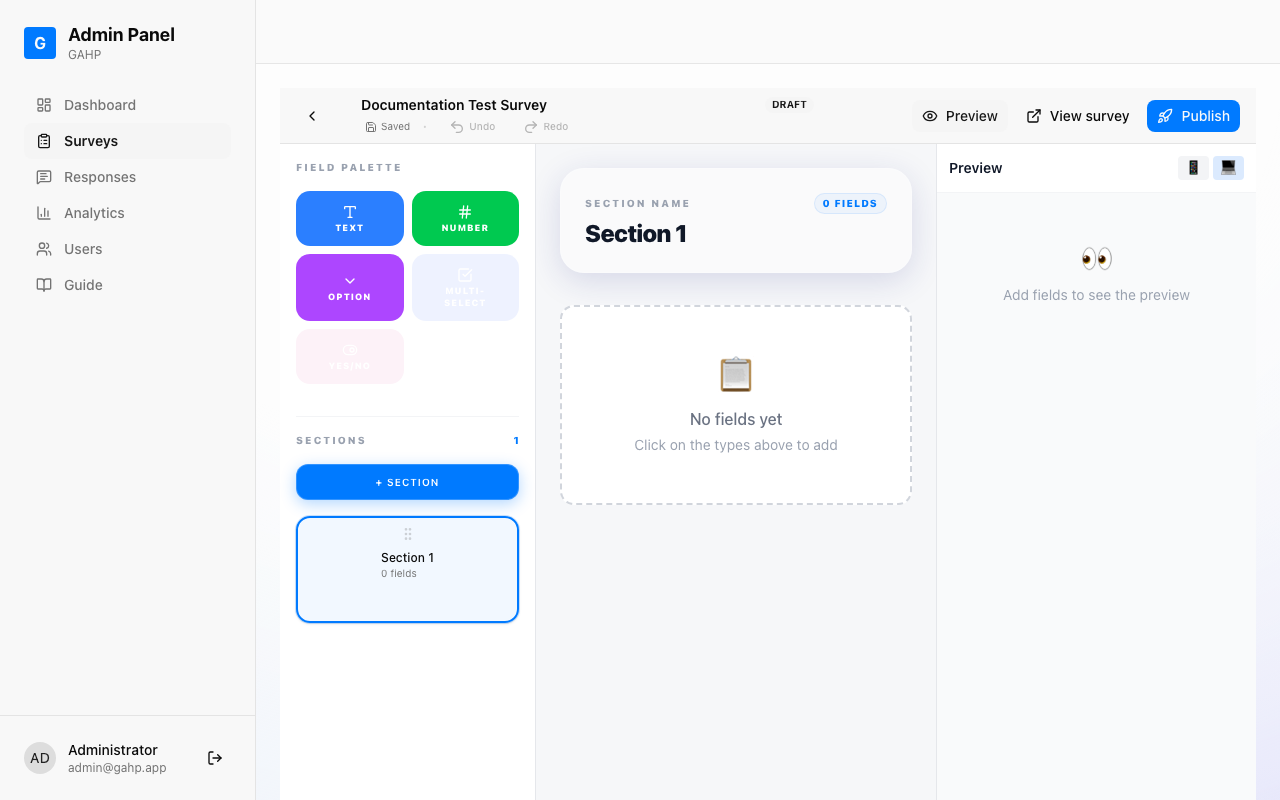
Figure 12: Sections appear in the left sidebar of the editor
Section Actions
- Add Section — Click + SECTION button
- Copy Section — Click the copy icon to duplicate a section with all its fields
- Delete Section — Click the trash icon (you'll be asked to confirm)
- Reorder Sections — Drag sections using the drag handle
Tips for Good Survey Structure
- Group related questions together (e.g., "Personal Info", "Work History", "Health Symptoms")
- Keep sections to 5-10 questions for better user experience
- Put required questions in earlier sections
- Use logical flow — start with easy questions to build rapport
Conditional Fields (Show/Hide Logic)
You can configure fields to only appear based on answers to previous questions. This is called conditional logic.
Example: Show "Are you pregnant?" ONLY if "Gender" equals "Female"
How to Set Up Conditions:
- Expand the field you want to make conditional
- Find the Condition section
- Set Show this field if
- Choose the triggering field (e.g., "Gender")
- Choose the condition (e.g., "equals")
- Set the value (e.g., "Female")
- Show pregnancy question only for female respondents
- Show "Other" text field only if "Other" is selected from options
- Show detailed questions only if a risk factor is present
Field Validation Settings
- Required — Must be answered before submitting
- Min/Max (Numbers) — Set acceptable numeric range
- Min/Max (Scale) — Set the scale range (e.g., 1-10)
Quick Reference
Survey Editor — Field Types Reference
| Type | Data Captured | Configuration |
|---|---|---|
| TEXT | Single line of text | Label, Placeholder, Required |
| TEXTAREA | Multiple lines of text | Label, Placeholder, Required |
| NUMBER | Integer or decimal number | Label, Placeholder, Required, Min, Max |
| OPTION | One choice from list | Label, Placeholder, Required, Options |
| MULTI-SELECT | Multiple choices (checkboxes) | Label, Placeholder, Required, Options |
| YES/NO | Binary choice (radio buttons) | Label, Required |
| SCALE | Number on a scale (buttons) | Label, Required, Min, Max |
| DATE | Date (date picker) | Label, Required |
| CHECKBOX | Single checkbox boolean | Label, Required |
| PHOTO | Photo taken with device camera | Label, Required |
| LOCATION | GPS coordinates (lat/lng) | Label, Required |
Roles and Permissions Reference
| Role | Capabilities |
|---|---|
| Administrator | Full access: create/edit/delete surveys, view all responses, analytics, manage users |
| Surveyor | Complete surveys, view own response history |
Sync Status Reference
| Status | Meaning |
|---|---|
| Synced (Green) | Response has been uploaded to the server |
| Pending (Yellow) | Response saved locally, waiting to upload |
| Offline Mode (Red) | No internet connection — data saved locally |